Troubleshooting Windows devices in enterprise environments can be challenging, especially when dealing with intermittent errors that occur outside business hours. Microsoft Intune’s Remediation Scripts feature provides a powerful way to automatically collect System Event Logs from managed devices without manual intervention.
In this comprehensive guide, you’ll learn how to set up automated log collection that exports Windows System Event Logs in a format compatible with Configuration Manager Trace Log Tool (CMTrace), making it easier to diagnose issues across your device fleet.
What You’ll Achieve
By the end of this tutorial, you’ll have:
- An automated process that collects the latest 100 System Event Logs
- Logs formatted for CMTrace with proper color coding (errors, warnings, and informational events)
- Files stored in the Intune Management Extension logs directory for easy retrieval
- Integration with Intune’s Collect Diagnostics feature for centralized log gathering
Why Collect Windows Error Logs via Intune?
When managing Windows devices with Microsoft Intune, one of the biggest challenges for IT admins is remote troubleshooting.
Event Viewer holds valuable error information, but accessing it manually requires:
- User involvement
- Remote sessions
- Time-consuming back-and-forth
By combining Intune Remediation Scripts with the Collect Diagnostics device action, you can:
- Automatically collect System Event logs
- Store them in a standardized location
- Retrieve them remotely from Intune
- Reduce MTTR (Mean Time to Resolution)
This approach is silent, repeatable, and scalable.
Prerequisites
Before you begin, ensure you have:
- Microsoft Intune subscription with appropriate licensing
- Devices enrolled in Intune (Windows 10/11)
- Global Administrator or Intune Administrator role
- Basic understanding of PowerShell scripting
- CMTrace tool for viewing logs (optional but recommended)
Solution Overview
This solution consists of two parts:
1. Proactive Remediation (Runs on a Schedule)
- Always triggers remediation
- Collects the last 100 System Event Logs
- Writes logs in CMTrace format
- Overwrites the log every run
2. Collect Diagnostics (On-Demand)
- Admin-initiated from Intune portal
- Downloads the generated log file from the device
- No user interaction required
Step 1: Create the Detection Script
The detection script’s purpose is to determine whether remediation is necessary. For log collection, we want remediation to run every time, regardless of device state.
Detection Script (Always Trigger Remediation)
# Always Trigger Remediation

Write-Output "Forcing remediation run"

Exit 1
How It Works
- Write-Output: Logs a message indicating the script executed
- Exit 1: Returns a non-zero exit code, signaling Intune that remediation is required
- This ensures the remediation script runs on every scheduled execution
Why This Approach?
Unlike traditional remediation scenarios that fix issues, our goal is continuous monitoring. By always exiting with code 1, we ensure the log collection runs according to your defined schedule (hourly, daily, etc.).
Step 2: Create the Remediation Script
The remediation script handles the actual log collection and formatting.
Remediation Script (Create or Overwrite Log File)
$logPath = "C:\ProgramData\Microsoft\IntuneManagementExtension\Logs\SystemEventLogStatus.log"

$logDir  = Split-Path $logPath -Parent


# Ensure directory exists

if (!(Test-Path $logDir)) {

    New-Item -Path $logDir -ItemType Directory -Force | Out-Null

}

# Collect System Event Log errors, warnings, and information (last 100)

$eventErrors = Get-EventLog -LogName System -Newest 100

# Export to log file in CMTrace format (always overwrite)

$logContent = foreach ($logEvent in $eventErrors) {

    $time = $logEvent.TimeGenerated.ToString("HH:mm:ss.fff")

    $date = $logEvent.TimeGenerated.ToString("MM-dd-yyyy")

    $message = $logEvent.Message -replace "`r`n", " " -replace "`n", " "

    # Map EntryType to CMTrace type (1=Info, 2=Warning, 3=Error)

    $type = switch ($logEvent.EntryType) {

        'Error' { '3' }

        'Warning' { '2' }

        default { '1' }

    }

    "<![LOG[$message]LOG]!><time=""$time+000"" date=""$date"" component=""$($logEvent.Source)"" context=""$($logEvent.EventID)"" type=""$type"" thread=""0"" file=""System"">"

}

$logContent | Out-File -FilePath $logPath -Encoding UTF8 -Force

Write-Output "Event Log Error status exported to $logPath"
Exit 0
Why Use CMTrace Format?
CMTrace format offers several benefits:
- Readable in CMTrace.exe
- Structured metadata (time, date, source, event ID)
- Easier correlation during troubleshooting
- Consistent with Microsoft logging standards
Even if you don’t use CMTrace today, this format future-proofs your logs.
Step 3: Deploy the Remediation Script in Intune
Create the Remediation Script Package
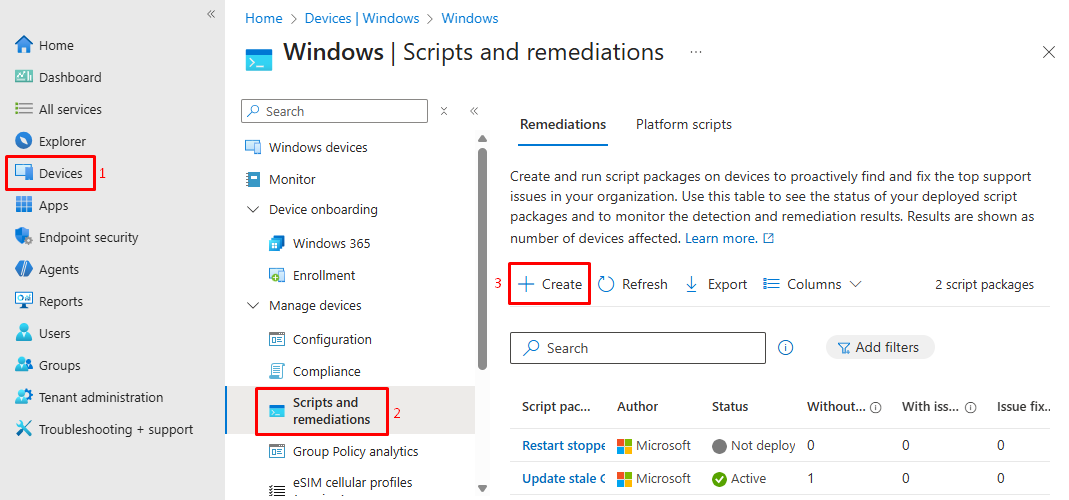
- Sign in to the Microsoft Intune admin center (https://intune.microsoft.com)
- Navigate to Devices > Windows > Scripts & Remediations (under Manage section)
- Click + Create
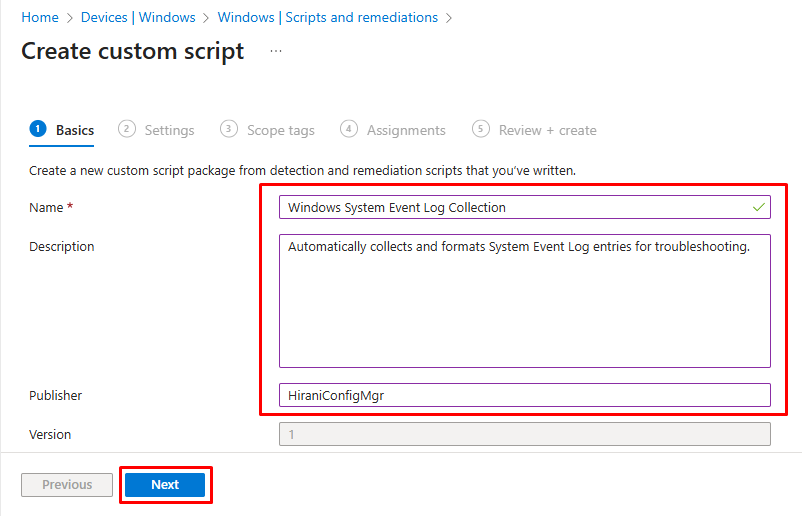
4. Basics Tab:
-
- Name:
<span lang="EN-US" xml:lang="EN-US" data-contrast="auto">Windows System Event Log Collection</span> - Description:
Automatically collects and formats System Event Log entries for troubleshooting - Publisher:
Your organization name - Click Next
- Name:
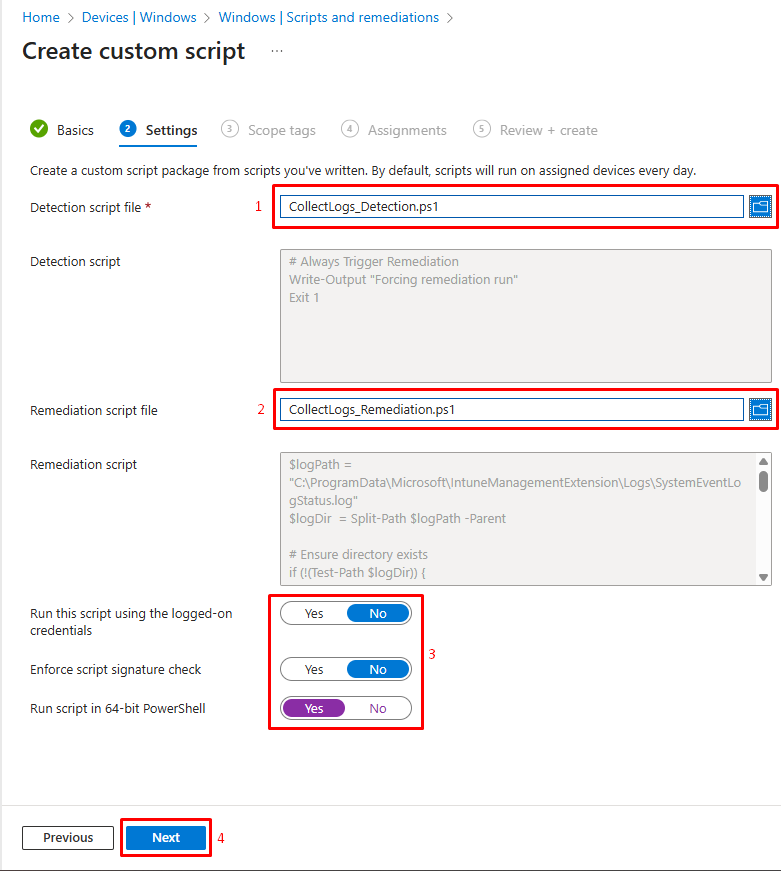
5. Settings Tab:
-
- Detection script: Upload the detection script
- Remediation script: Upload the remediation script
- Run this script using the logged-on credentials: No
- Enforce script signature check: No
- Run script in 64-bit PowerShell: Yes
- Click Next
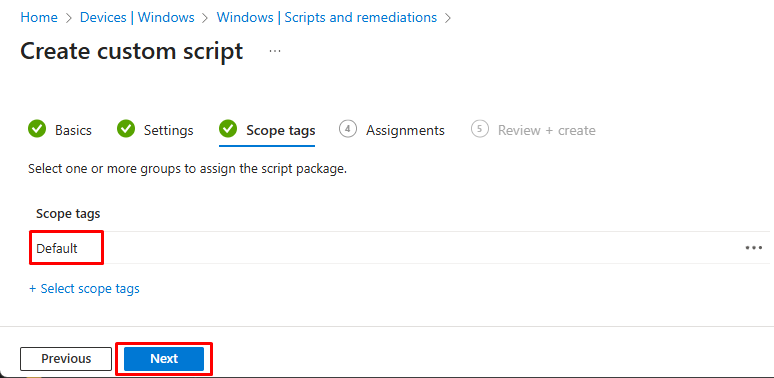
6. Scope Tags Tab:
-
- Add appropriate scope tags if your organization uses them
- Click Next
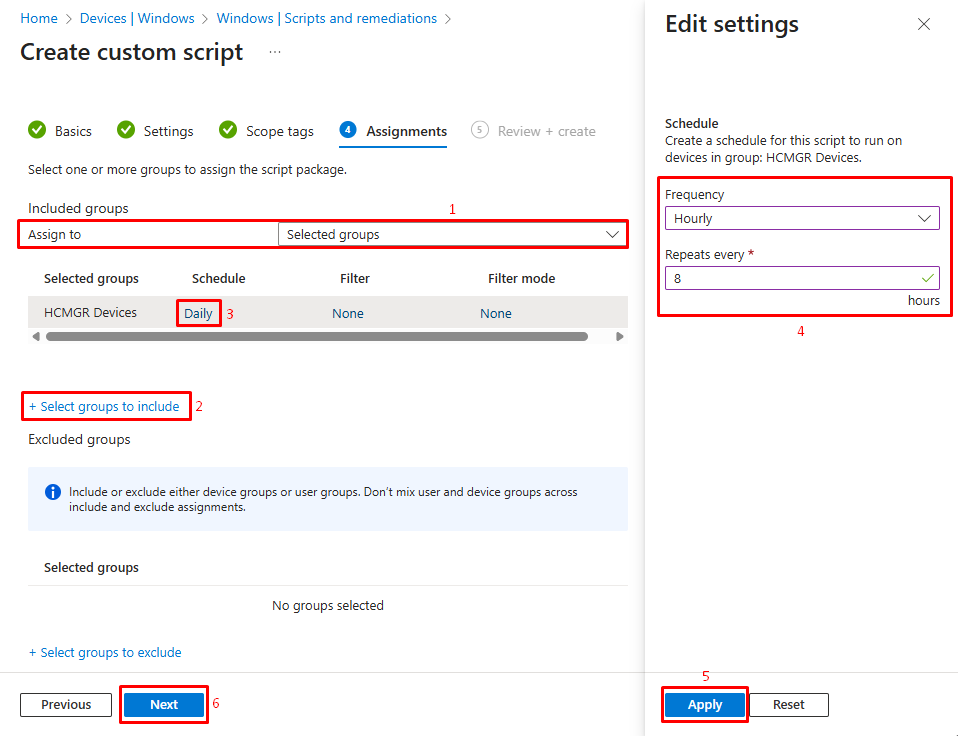
7. Assignments Tab:
-
- Click + Add all devices or + Add all users
- Alternatively, select specific groups to target
- Configure schedule:
- Run this script once: No
- Frequency: Select based on your needs (Daily recommended)
- Start time: Choose appropriate time
- Click Next
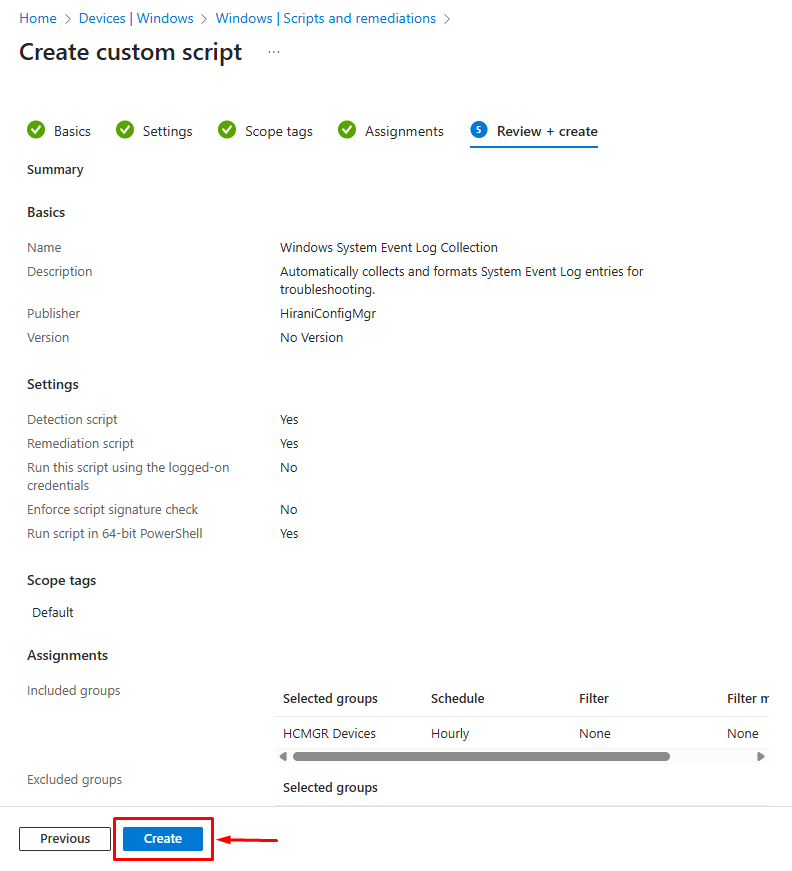
8. Review + Create:
-
- Verify all settings
- Click Create
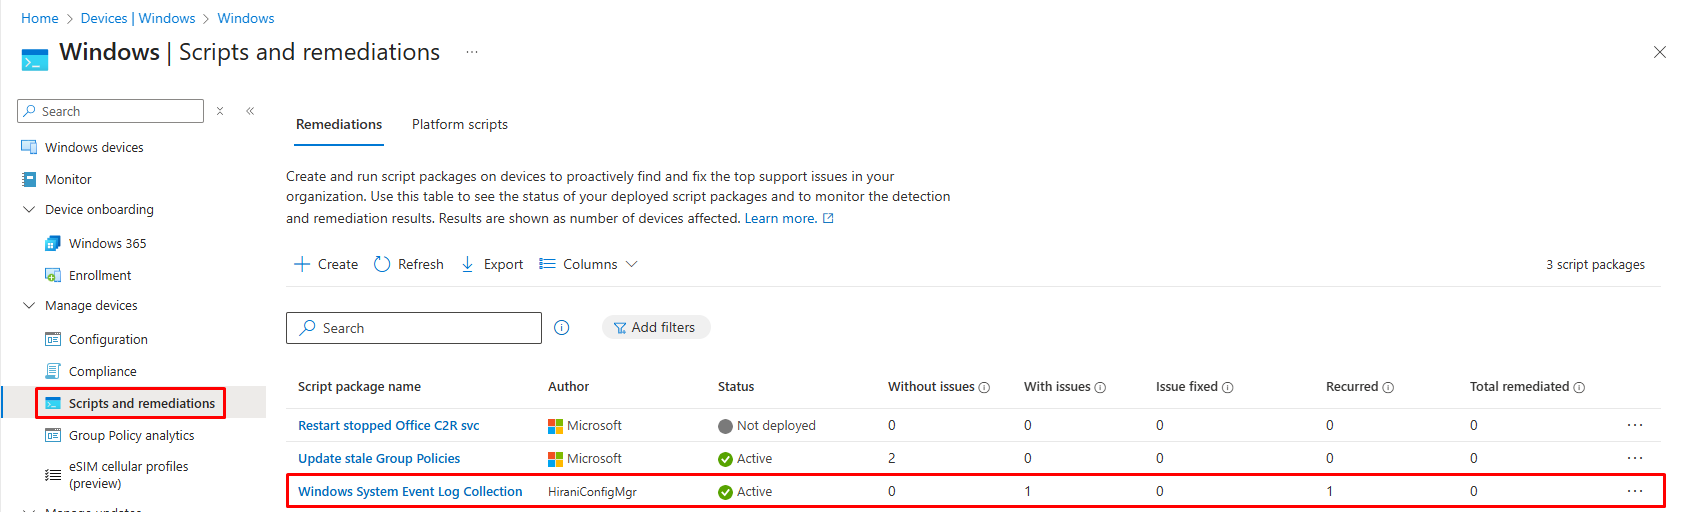
Step 4: Monitor Script Execution
Check Deployment Status
- In the Intune admin center, go to Devices > Remediations
- Click on your Windows System Event Log Collection package
3. Review the Overview tab:
-
- With issues: Devices where remediation failed
- Without issues: Devices where detection passed (none in our case)
- Pending: Devices that haven’t checked in yet
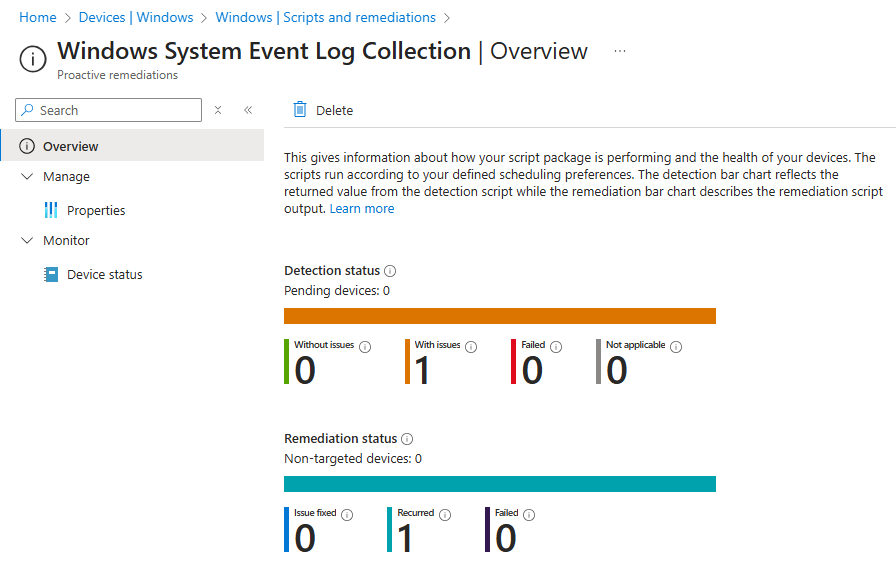
4. Click on Device status to see detailed individual devices execution results
Verify Local Execution
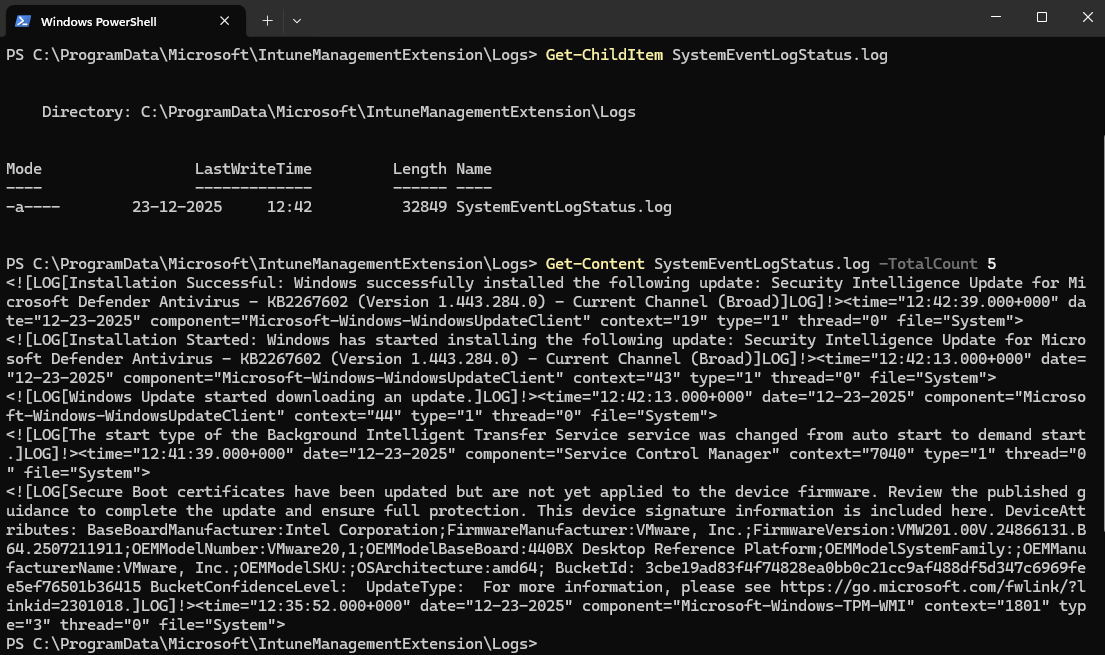
On a test device, you can manually verify:
- Open PowerShell as Administrator
- Navigate to the log directory:
cd C:\ProgramData\Microsoft\IntuneManagementExtension\Logs
3. Check if the log file exists:
Get-ChildItem SystemEventLogStatus.log
4. View the first few lines:
Get-Content SystemEventLogStatus.log -TotalCount 5
Step 5: Collect Logs Using Intune Diagnostics
Understanding Collect Diagnostics
Intune’s Collect Diagnostics feature automatically gathers logs from managed devices, including files stored in the IntuneManagementExtension\Logs directory where our error log resides.
Initiate Log Collection
- In the Intune admin center, navigate to Devices > All devices
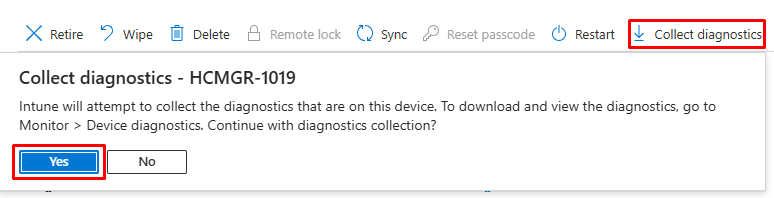
- Select the target device
- Click Collect diagnostics from the top menu
- Click Yes to confirm
5. Wait for the collection to complete (typically 5-15 minutes)

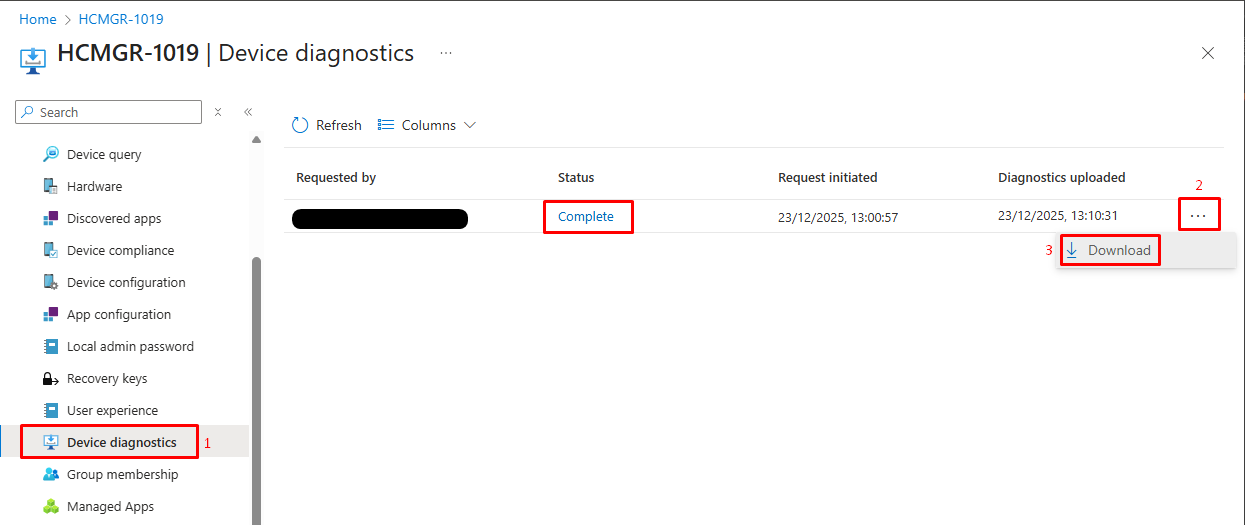
6. Download and Review Logs
7. Once collection completes, click Download next to the diagnostics entry
8. Extract the downloaded ZIP file
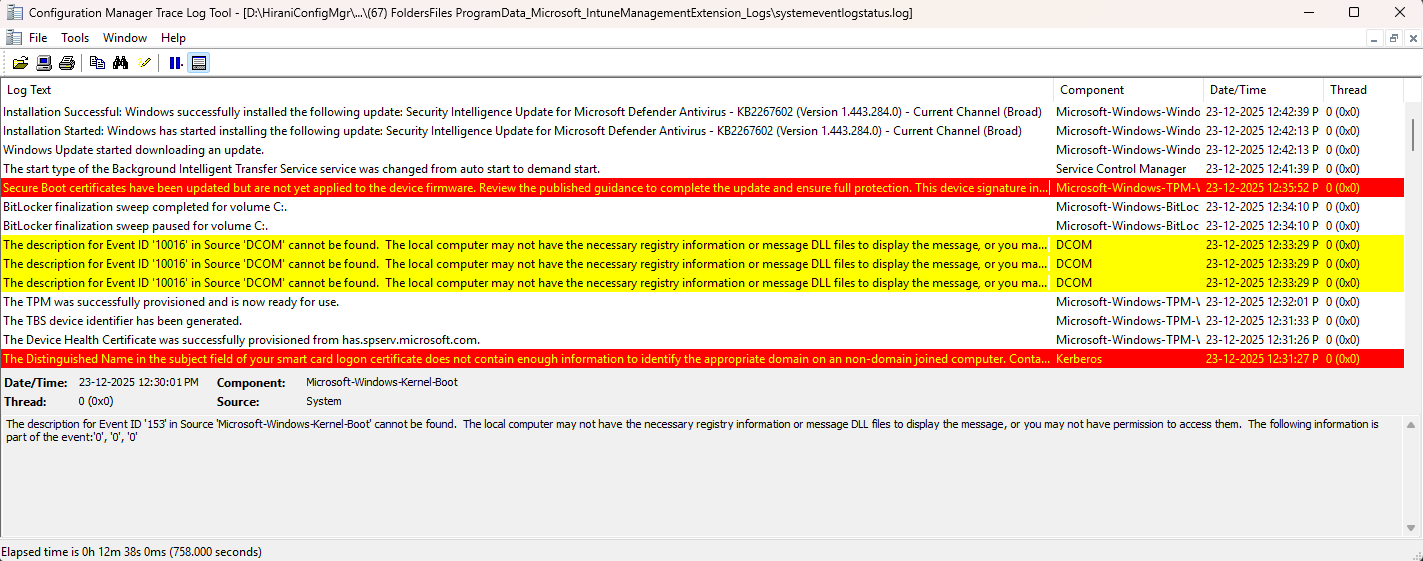
9. Navigate to the folder structure and locate:
(67) FoldersFiles ProgramData_Microsoft_IntuneManagementExtension_Logs\SystemEventLogStatus.log
10. Open the log file with CMTrace for best viewing experience
Real-World Use Cases
This approach is extremely useful for:
- Hyper-V / TPM / Secure Boot issues
- Random device reboots or freezes
- Driver failures after Windows updates
- Proactive monitoring in pilot deployments
- Tier-1 support log collection without user calls
Final Thoughts
By combining Intune Remediation Scripts with the Collect Diagnostics device action, you turn Intune into a proactive diagnostics platform, not just a device management tool.
This method gives IT teams visibility, consistency, and speed, all while staying fully cloud-native.
If you’re serious about modern Windows endpoint troubleshooting-this pattern is a must-have.